Problem Definition
The three-dimensional steel truss structure shown below is composed of 260 members and 76 nodes. Sizing and shape optimization of this truss is considered. The topology of the truss (i.e. the way that the nodes are connected to each other) is assumed to be fixed and unchangeable. The structure is designed under three independent load cases, where the loads are applied at all unsupported nodes of the truss in the following cases: (i) horizontal loads of 5kN applied in the positive x-direction, (ii) horizontal loads of 1kN applied in the positive y-direction, (iii) vertical loads of 5kN applied in the negative z-direction. The displacements of all nodes in x, y, and z directions are limited to a maximum value of ±25 mm. The material density, elastic modulus, and yield stress of the truss material are 7.85 ton/m3, 200 GPa and 248.2 MPa, respectively. The structure is designed in accordance with the regulations of AISC-LRFD 1994. To this end, each member is checked considering the limit states of tensile yielding and compressive buckling. A simple MATLAB function for the structural analysis and design of this particular truss is provided below.
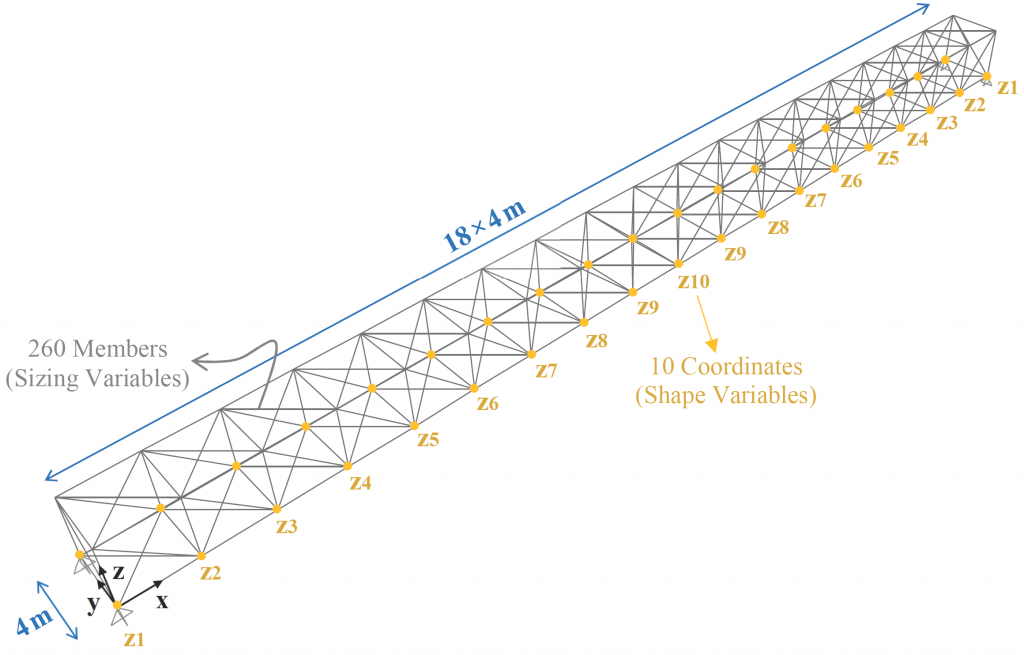
This problem includes 260 sizing variables (which represent the cross-sections of the truss members) as well as 10 shape variables (which are the z-coordinates of the bottom orange nodes of the structure, including the support nodes, which are grouped symmetrically about the mid-span). Therefore, in total, the problem consists of 270 design variables. It should be emphasized that each pair of orange nodes with the same x-coordinate will have the same height. The following should be satisfied:
- Find the sizing variables (S1 to S260) as well as shape variables (z1 to z10) which would minimize the weight of the structure according to the given constraints. However, the maximum number of objective function evaluations that you are allowed to perform, using the given MATLAB function, is 200,000 times. In other words, you are only allowed to call the given MATLAB function 200,000 times (maximum) during your optimization process. Note that, structural analysis and design shall be performed using the given MATLAB function only.
- You can use any optimization technique. Further, you may propose a new optimization algorithm or a hybrid form of previously proposed algorithms. However, using commercial optimization software is not allowed and the participants must prepare their own original codes.
- The optimization process shall always start from a random point in the design space. In other words, the initial 270 design variables of your optimization procedure shall be selected randomly.
- The sizing variables (S1 to S260) can only take integer values ranging from 1 through 37 (i.e. 1 ≤ si ≤ 37). Each sizing variable represents a section ID from the following database of 37 pipe sections.
- For the shape variables (z1 to z10) use integer values only. The lower and upper bounds on the shape variables are -25000 ≤ zi ≤ +3500 i.e. for zi you can select the shape variables as integer values ranging from -25000 to 3500 mm.
- The final optimum design shall be feasible (i.e. no constraint violation is allowed). The amount of constraint violation associated with your proposed design is also reported by the structural analysis and design MATLAB function, given below.
- Grouping of the design variables is not allowed neither at the beginning of the optimization process nor in the course of optimization.
- For the sake of conformity, please solve the problem in the given units.
- Submit your code, the final optimum design with all the 270 design variables, and a brief description of your optimization approach in a single PDF through the submission system before the deadline.
Structural Analysis and Design Function
A simple MATLAB function is provided for the structural analysis and design of the given truss system. The file can be downloaded from here. Please extract the zip file to get the ISCSO_2019.p MATLAB function. You can readily use this function anywhere in your optimization code using the following command:
[Weight, Const_Vio_Stress, Const_Vio_Disp] = ISCSO_2019(Sections, Coordinates, Flag)
The terms inside the parentheses on the right-hand side of the function represent the input variables which you should provide to the function:
- “Sections” is a row vector (size 1×260) which contains the sizing variables S1 to S260.
- “Coordinates” is a row vector (size 1×10) containing the shape variables z1 to z10.
- “Flag” is either 0 or 1. The value of zero indicates that no graphical output is requested from the function. On the other hand, if Flag is set to 1, the function will plot the undeformed geometry of the proposed truss structure. In addition, the nodes that violate the displacement constraints and the members that violate the stress constraints are colored in red. This is further discussed below.
The terms inside the brackets on the left-hand side of the function represent the output variables which are calculated by the function and reported to your MATLAB Workspace:
- “Weight” is the net weight of the proposed structure.
- “Const_Vio_Stress” is the relative amount of constraint violation based on the stress constraints. If a value of zero is reported by the function it means that all of the truss members have satisfied the stress requirements. Any value larger than zero indicates that one or more truss members have not satisfied the design regulations of AISC-LRFD 1994.
- “Const_Vio_Disp” is the relative amount of constraint violation based on the displacement constraints. If a value of zero is reported by the function it means that the displacement of all nodes is in the allowable range of ± 25 mm. Any value larger than zero indicates that the displacement of one or more nodes has violated this limit.
The utilization of the given MATLAB function is further discussed through an example. Assume that the section ID for all members of a proposed truss structure is equal to 20 and the z-coordinate of all nodes of the lower chord is equal to -5000 mm. To evaluate this structure, two row vectors are first defined:
Sections = [20, 20, 20,…, 20] 1×260
Coordinates = [-5000, -5000, -5000,…, -5000] 1×10
Afterwards, the ISCSO_2019 function should be called. Here, the value of Flag is set equal to 1, assuming that the graphical output is requested by the user. If the graphical output is not required, the Flag (last term inside the parentheses) should be set equal to 0 in the following command:
[Weight, Const_Vio_Stress, Const_Vio_Disp] = ISCSO_2019(Sections, Coordinates, 1)
By executing the above command 3 output variables (“Weight”, “Const_Vio_Stress”, and “Const_Vio_Disp”) will appear in your MATLAB Workspace and the following figure will be plotted on your screen which can be moved and resized:
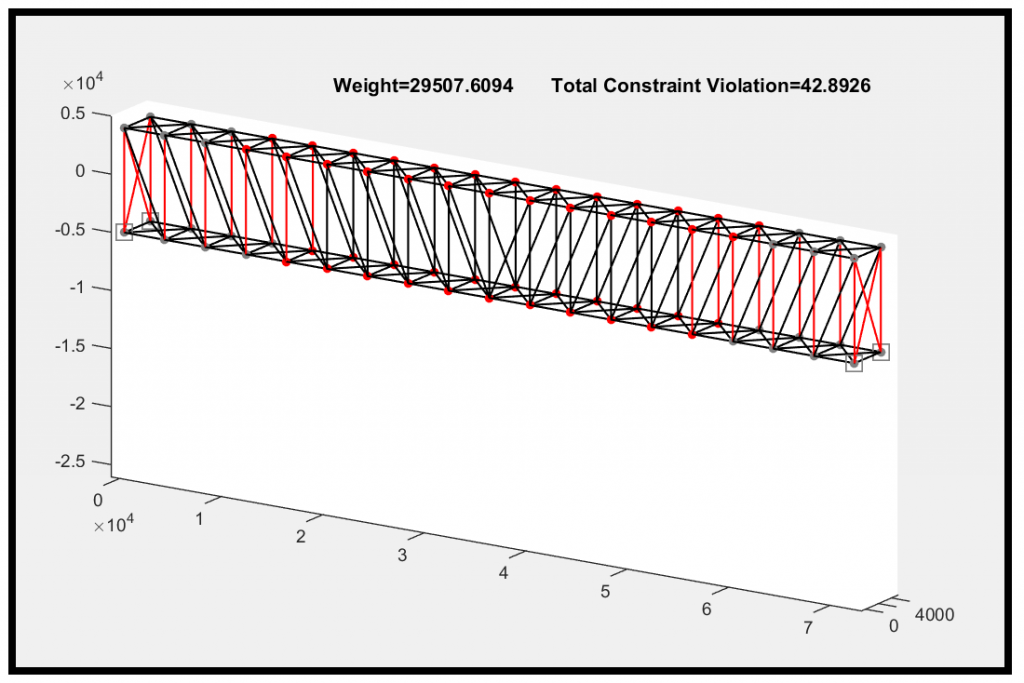
The nodes and members that are colored in red represent nodes and members which violate the displacement and stress constraints, respectively. At the top of the figure, weight of the proposed structure, as well as the total constraint violation (i.e. sum of “Const_Vio_Stress” and “Const_Vio_Disp” values) are displayed.
Good Luck!
Winner of ISCSO 2019
The winner of ISCSO 2019 is Kazuki Hayashi from Kyoto University, Japan. You may find further information about the winner and the reported optimum design here.