Problem Definition
Consider the sizing and shape optimization of the 45-bar planar truss structure, shown below. The topology (i.e. the way that the nodes are connected to each other) for the truss is assumed to be fixed. Three vertical loads are applied simultaneously to the structure as follows: two loads of P1 = 60 kips are applied at nodes 15 and 19 and a single load of P2 = 80 kips is applied at node 17. The stress limit is 30 ksi in both tension and compression for all the members. The displacement of all nodes in both horizontal and vertical directions is limited to ± 2.0 in. The material density is 0.283 lb/in.3 and the modulus of elasticity is 30,000 ksi. A simple MATLAB function for structural analysis and design of this particular truss is given below.
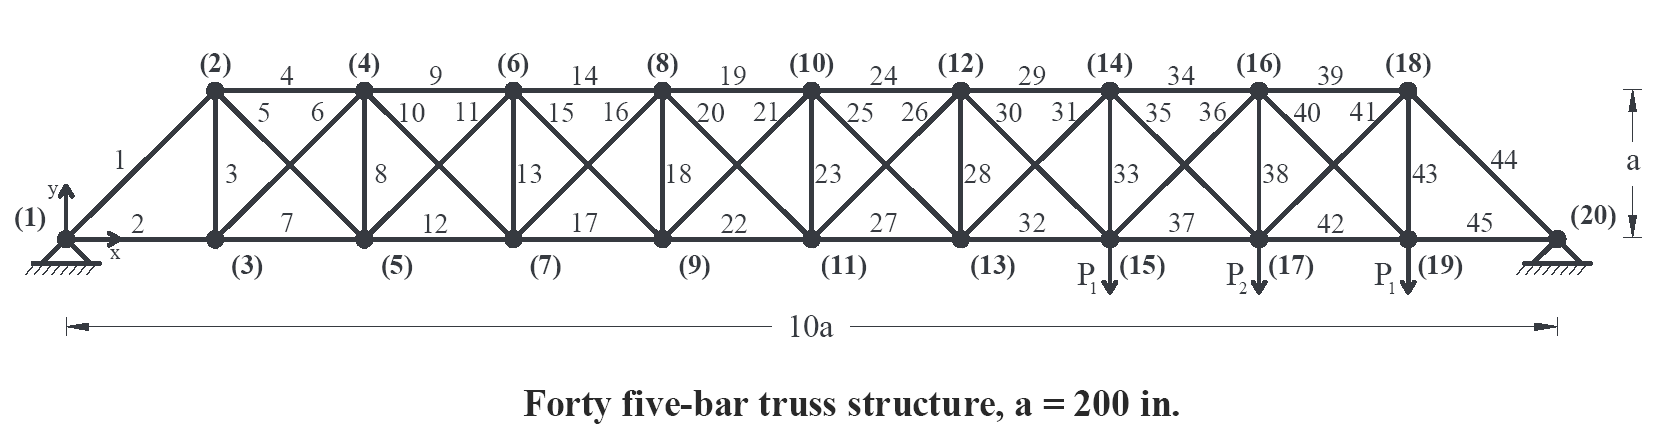
The problem includes 45 sizing variables (cross-sectional areas of truss members) and 9 shape variables namely the vertical coordinates (i.e. y-coordinates) of nodes 2, 4, 6, 8, 10, 12, 14, 16, and 18, resulting in a total of 54 design variables. The following should be satisfied:
- Find the sizing variables (A1 to A45) as well as shape variables (y2, y4, y6, y8, y10, y12, y14, y16, y18) which minimize the weight of the structure according to the given constraints. However, the maximum number of structural analyses and designs that you are allowed to perform, using the MATLAB function given below, is 7000 times. Note that, structural analysis and design shall be performed using the given MATLAB function only.
- You can use any optimization technique. Further, you may propose a new optimization algorithm or a hybrid form of previously proposed algorithms. However, using commercial optimization software is not allowed and the participants must prepare their own original codes.
- The optimization process shall always start from a random point in the design space. In other words, the initial 54 design variables of your optimization procedure must be selected randomly.
- For the shape variables, use discrete integer values only. The lower and upper bounds on the shape variables are 100 and 1400 in., respectively. Thus, you can select the y-coordinate of each node of the upper chord of the truss (y2, y4, y6, y8, y10, y12, y14, y16, y18) as an integer value ranging from 100 to 1400 in.
- For the sizing variables, use the list A = {0.1, 0.2, 0.3, …, 14.8, 14.9, 15} in.2 Thus, you can choose the cross-sectional areas of members (A1 to A45) from 0.1 to 15 in.2 with 0.1 in.2 increments.
- The final optimum design must be feasible (i.e. no constraint violation is allowed). The amount of constraint violation associated with your proposed design is also reported by the structural analysis and design MATLAB function, given below.
- For the sake of conformity, please solve the problem in British units.
- Submit your code, the final optimum design with all 54 design variables, and a brief description of your optimization approach in a single PDF before the deadline.
Structural Analysis and Design Function
A simple MATLAB function is provided for the structural analysis and design of the given truss system. The file can be downloaded from here. Please extract the zip file to get the ISCSO_2015.p MATLAB function. You can readily use this function anywhere in your optimization code using the following command:
[Weight, Const_Vio_Stress, Const_Vio_Disp] = ISCSO_2015(Areas, Coordinates, Flag)
The terms inside the parentheses on the right-hand side of the function represent the input variables which you should provide to the function:
- “Areas” is a row vector (size 1×45) which contains the sizing variables A1 to A45.
- “Coordinates” is a row vector (size 1×9) containing the shape variables (y2, y4, y6, y8, y10, y12, y14, y16, y18).
- “Flag” is either 0 or 1. The value of zero indicates that no graphical output is requested from the function. On the other hand, if Flag is given as 1, the function will plot the undeformed geometry of the proposed truss structure. In addition, the nodes that violate the displacement constraint and the members that violate the stress constraint are colored in red. This is further discussed below.
The terms inside the brackets on the left-hand side of the function represent the output variables which are calculated by the function and reported to your MATLAB Workspace:
- “Weight” is the net weight of the proposed structure.
- “Const_Vio_Stress” is the relative amount of constraint violation based on the stress constraint. If a value of zero is reported by the function it means that all of the truss members satisfy the stress requirement. Any value larger than zero indicates that the stress in one or more truss members has exceeded the stress limit of 30 ksi.
- “Const_Vio_Disp” is the relative amount of constraint violation based on the displacement constraint. If a value of zero is reported by the function it means that the displacement of all nodes is in the allowable range of ± 2.0 in. Any value larger than zero indicates that the displacement of one or more nodes has violated this limit.
The utilization of the given MATLAB function is further discussed through an example. Assume that the cross-sectional areas of a proposed structure are all equal to 2.5 in.2 and that the y-coordinate of all nodes of the upper chord of the truss is equal to 350 in. To evaluate this structure, two row vectors are first defined:
Areas = [2.5, 2.5, …, 2.5] 1×45
Coordinates = [350, 350, …, 350] 1×9
Then, the ISCSO_2015 function should be called. Here, the value of Flag is set equal to 1, assuming that the graphical output is requested by the user. If the graphical output is not required, the Flag (last term inside the parentheses) should be set equal to 0 in this statement:
[Weight, Const_Vio_Stress, Const_Vio_Disp] = ISCSO_2015(Areas, Coordinates, 1)
By executing the above command 3 output variables (“Weight”, “Const_Vio_Stress”, and “Const_Vio_Disp”) will appear in your MATLAB Workspace and the following figure will be plotted on your screen:
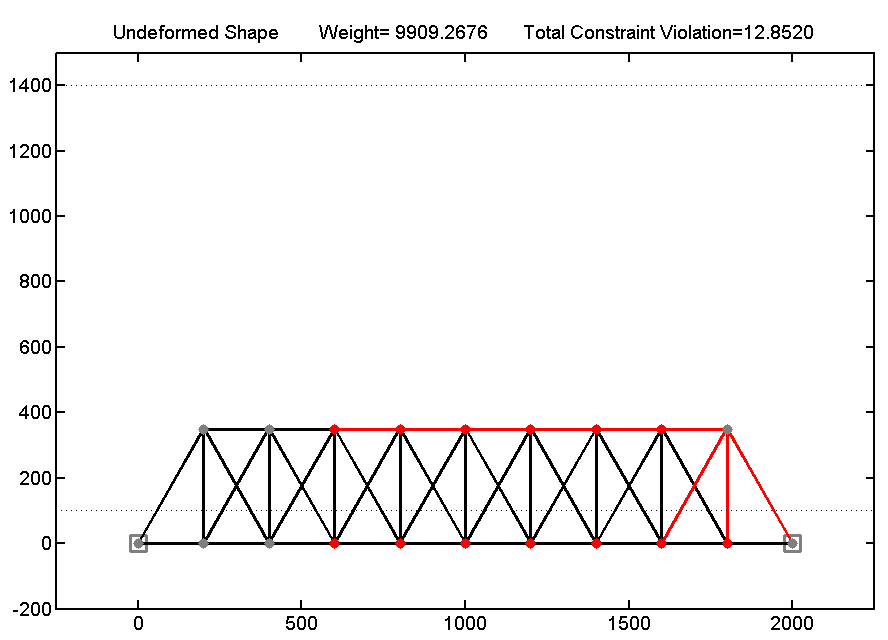 The nodes and members that are colored in red represent nodes and members which violate the displacement and stress constraints, respectively. Two dashed horizontal lines in the figure indicate the lower and upper bounds on the shape variables. At the top of the figure, weight of the proposed structure, as well as total constraint violation (i.e. sum of “Const_Vio_Stress” and “Const_Vio_Disp” values) are displayed.
Good Luck!
Winner of ISCSO 2015
The winner of ISCSO 2015 is Team COME from Technical University of Munich, Germany. You may find further information about this team and the reported optimum design here.